The pet care division of Mars, Kinship, had three years of dog and cat medical data based on age, breed, condition and zip codes. With over 2 million data points, plotting this on a normal map simply would not work. In addition they wanted marketing manages, customers and general employees to interact with the data in real-time making speed the upmost importance.
The design lead, Clarke, had created a beautiful concept to plot the data; however, on closer review it was clear the data wouldn't actually display in the chosen manner, and the shear scope of data would make it too slow to use.
Sourcetop's solution entailed creating a separate database crunching the numbers to each map zoom level and corresponding values. For instance, on initial view users choose either cats or dogs by state for a current year requiring only 51 data points on initial load. As the user zoomed to specific regions, narrowed by condition (e.g. obesity) and age (e.g. puppy) the data tables got more complex but still pulled from a pre-parsed table easily plotted within the constraints of a normal browser viewport.
To display the data, we built a highly customized Google Map with a toned-down theme, custom cluster logic and icons that changed transparency values based on zoom level. This allowed overlapping data to show rather than obscure at zoomed out levels. Data was also mapped to DMAs to show local market trends compared to national data.
We developed the prototype with a fixed set of data and later worked with the in-house team to tie directly to the master Kinship database updated with new data quarterly. A script is triggered whenever the master database is updated to reflect the latest changes allowing the platform to change and scale without further development.
This is available as a secured in-house website, but for launch, Kinship took over a room with two wall-sized touchscreen displays. Marketing managers where brought in to fully immerse themselves in the data letting them filter, zoom and explore their regions to find new opportunities in their markets – in realtime.
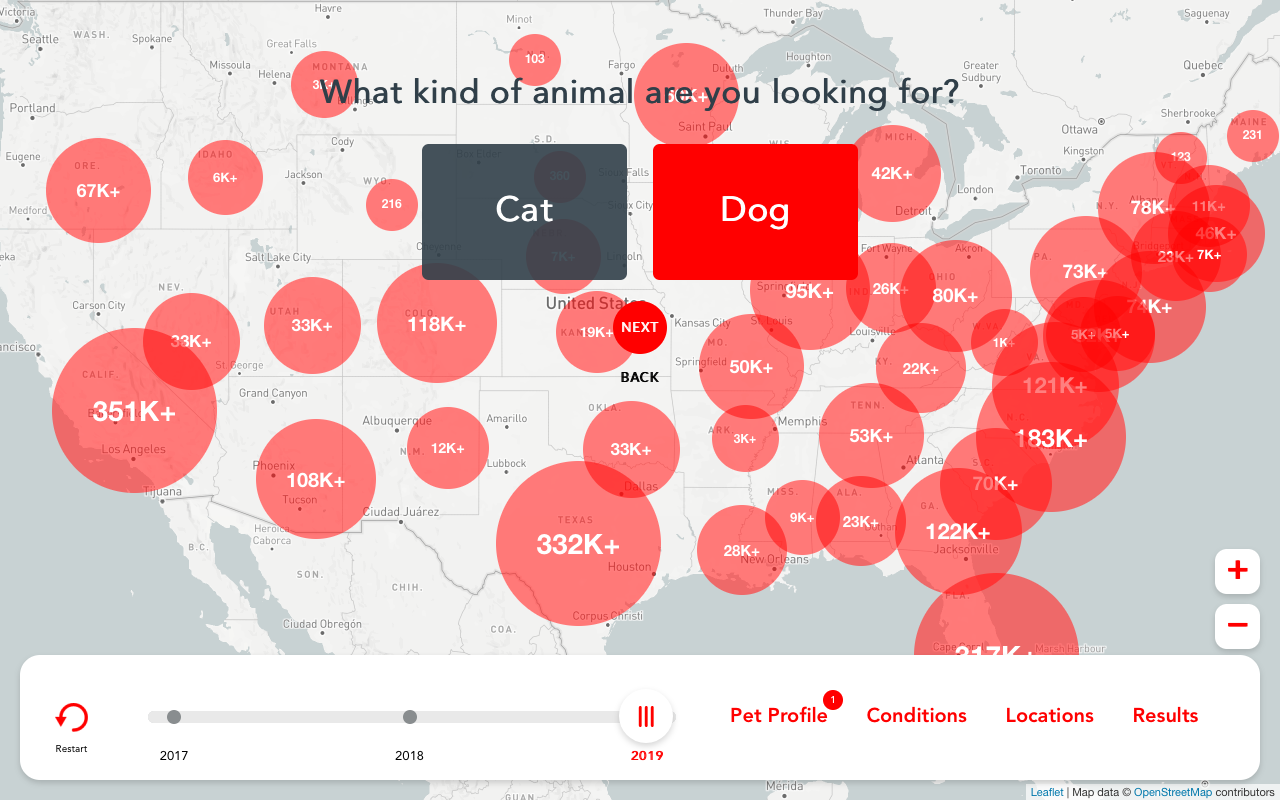
Custom clustering with dynamic sizes and transparency gives users a broad sense of national data without overwhelming them with too much detail.
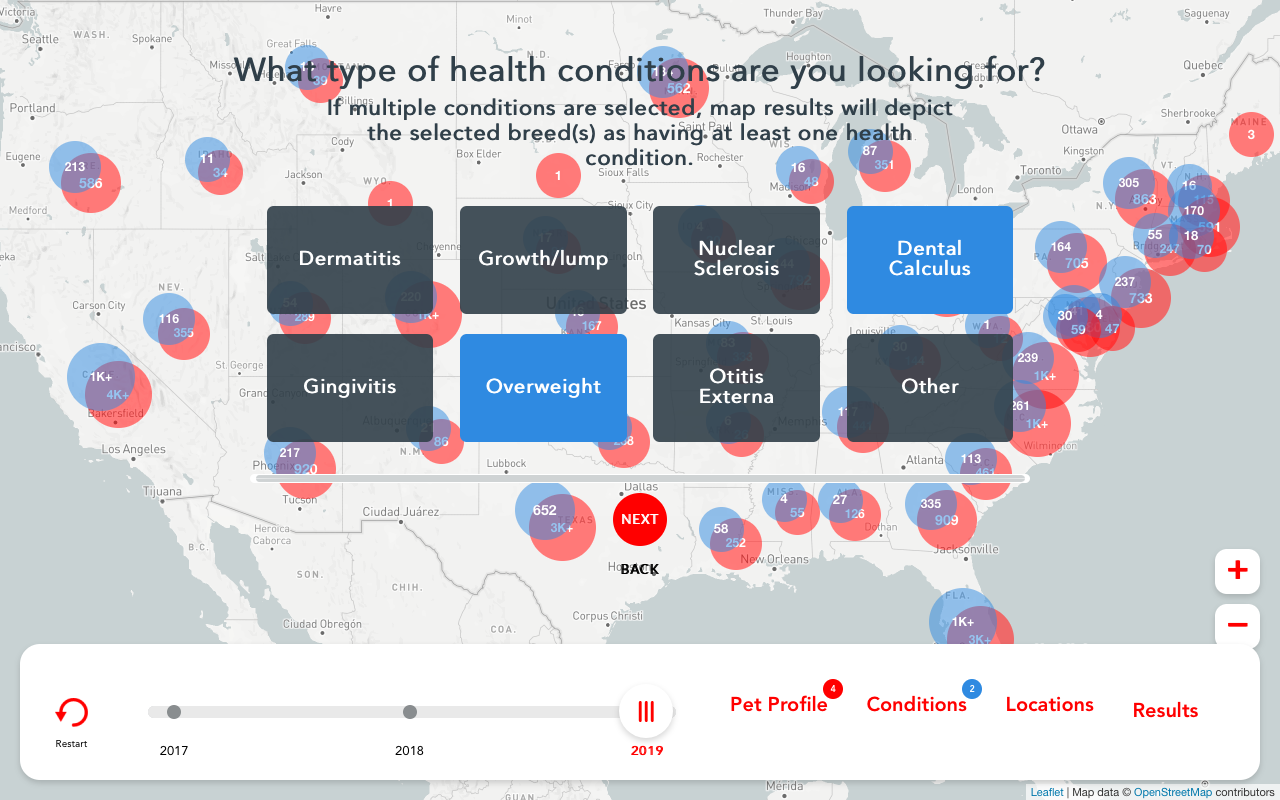
After selecting specific breeds and conditions the data starts to narrow.
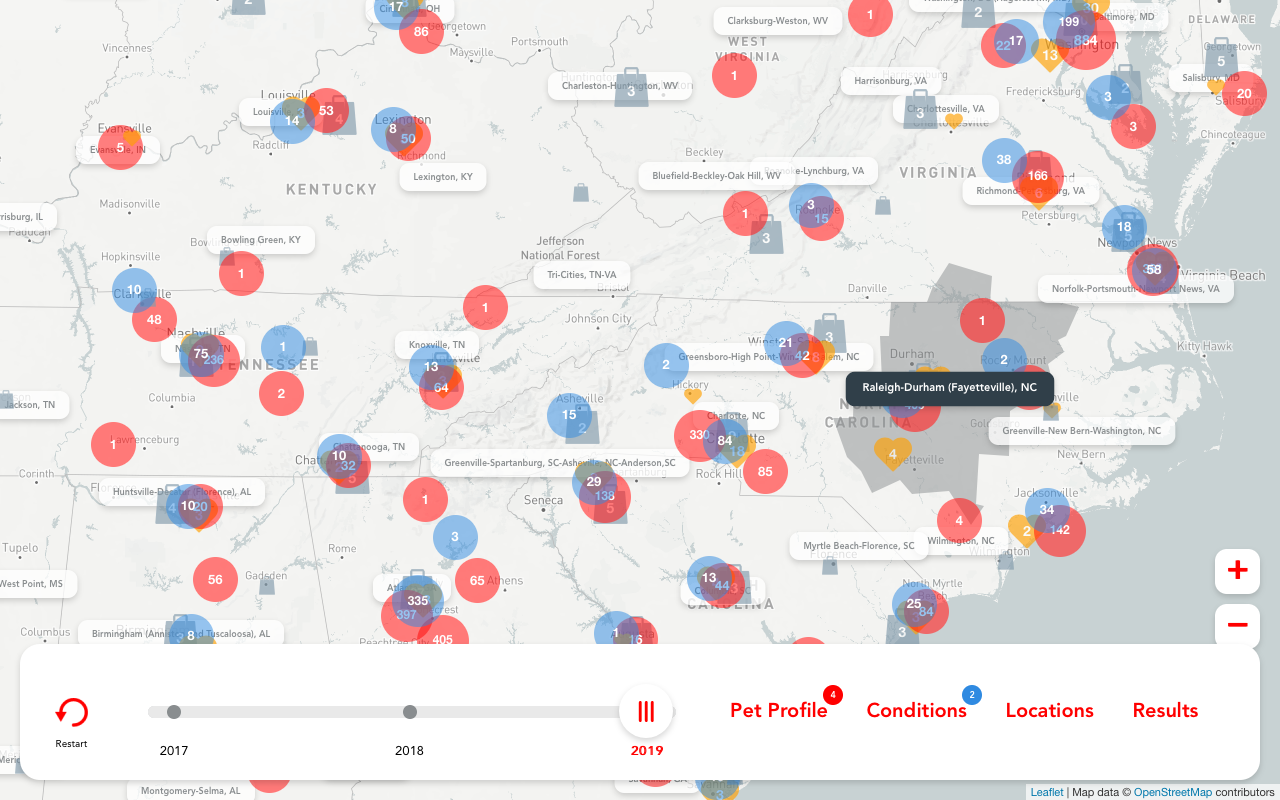
As users start to zoom in, DMA zones are shown.
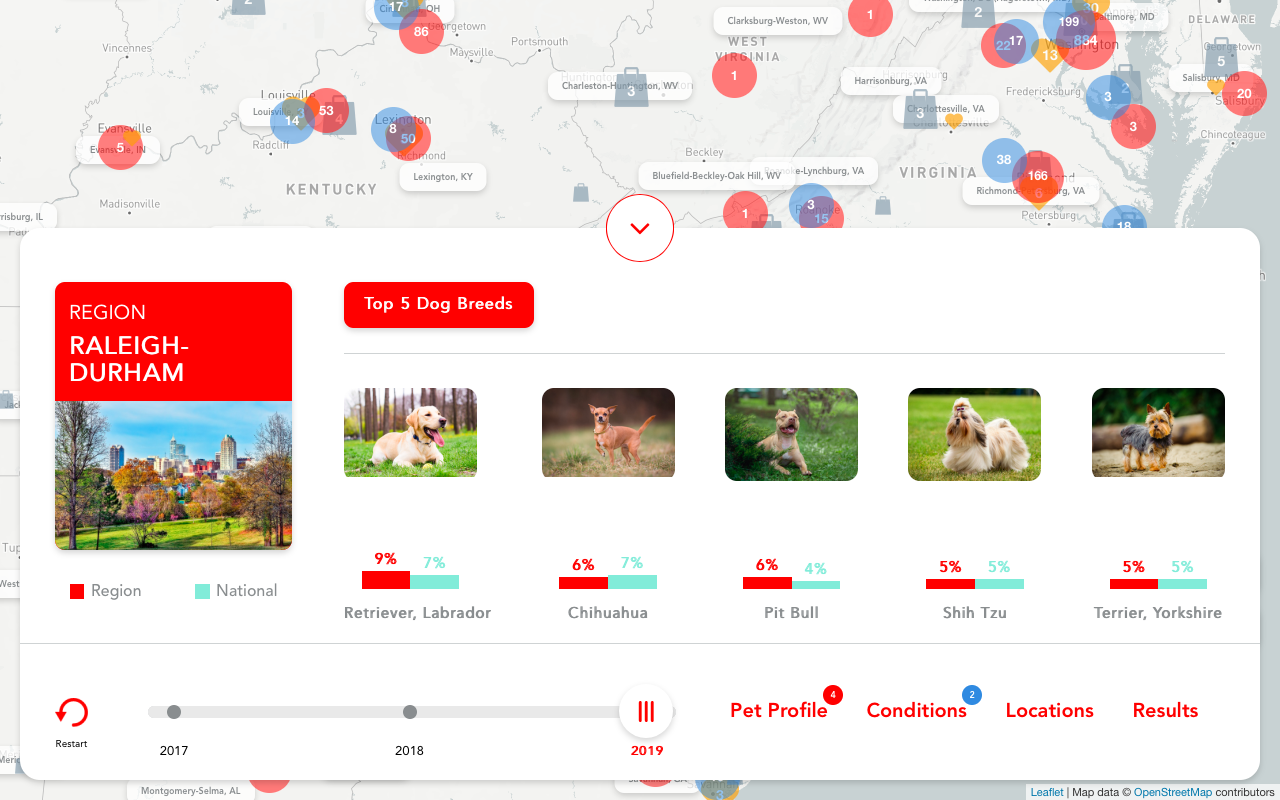
Each DMA shows highlighted data compared to national trends.